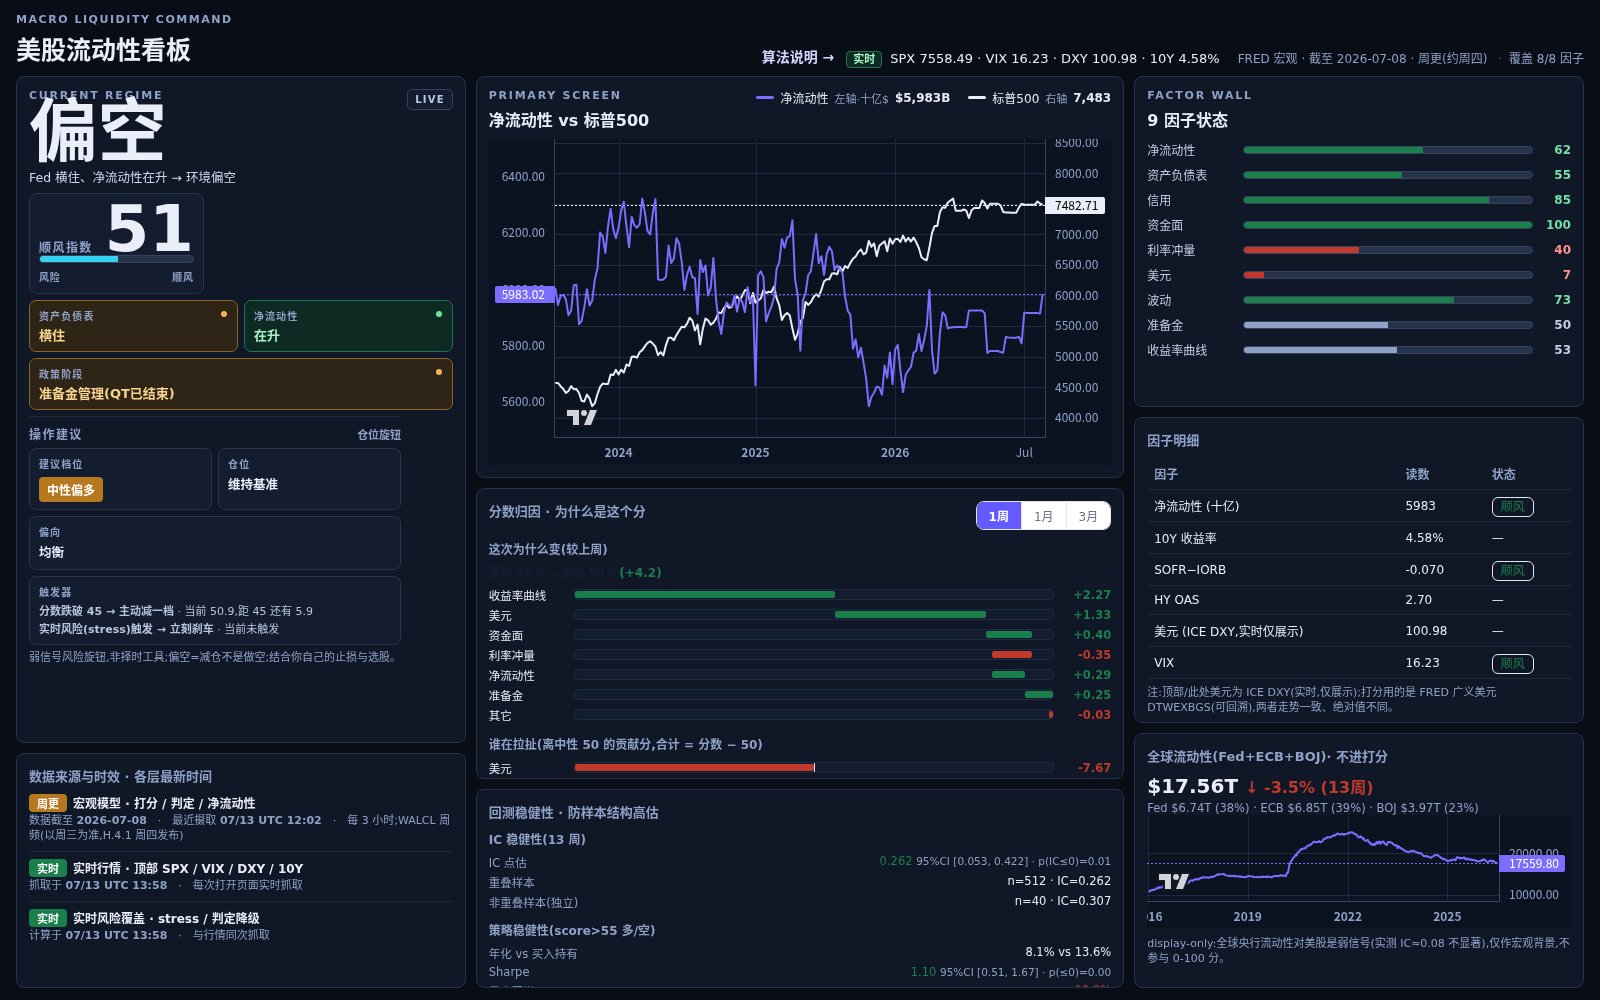
A US market-liquidity dashboard with an automated data pipeline, statistical guardrails, and reporting honest enough to say when a signal isn’t there.
Challenge
Market-liquidity dashboards tend to promise more than the data supports. We wanted the opposite: a system that ingests the numbers automatically, scores the environment, and states plainly how much predictive power the signal does — and doesn’t — have.
What we built
- An automated pipeline pulling macro and market data into D1 on a schedule, no hands on keyboards
- A liquidity regime score with per-factor attribution — every reading traceable to its inputs
- Statistical robustness checks and walk-forward validation built into the product, not run once and forgotten
- Honest no-alpha reporting: where the signal has no demonstrated edge, the dashboard says so on the page
Stack
Python for data collection and statistics, a Cloudflare Worker with D1 serving the dashboard and API from the edge.
Status
Updating daily, unattended.